
Latitude N 59° 16' 52" Longitude E 09° 44' 45" Elevation 86 m
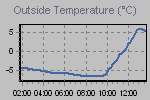
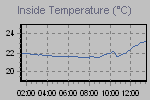
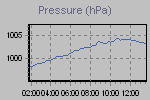
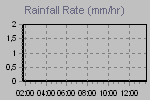
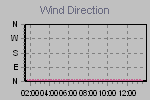
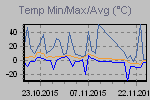
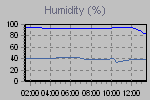
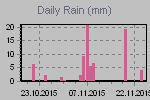
These graphs present the temperature, pressure, rainfall, and wind speed trends for the last 12 hours.
The thumbnail graphs are sampled every ten minutes. Click on a thumbnail to display the corresponding larger graph in the panel above it. The large graphs are sampled every minute.

| Click on a thumbnail to show a large graph in the panel above. | ||||
 |
 |
 |
 |
 |
 |
 |
 |
 |
 |
| :now::gauges::today::yesterday::records::trends::forum: | ||||
Page updated 26.11.2015 13:45:00
powered by
Cumulus v1.9.4 (1098)